
-
1. QuickStart
- 1.1. QuickStart of ZenTao 12 series
- 1.2. ZenTao 12 series Starter
-
1.3. ZenTao 12 series Advanced
- 1.3.1. Process overview
- 1.3.2. Personal issues management
-
1.3.3. Product manager
- 1.3.3.1 Manage product
- 1.3.3.2 Manage product line
- 1.3.3.3 Create and review stories
- 1.3.3.4 Change story and review story
- 1.3.3.5 Story status and development stages
- 1.3.3.6 Notes of the Story
- 1.3.3.7 Manage product module
- 1.3.3.8 Create plans
- 1.3.3.9 Create releases
- 1.3.3.10 Roadmaps
- 1.3.3.11 Document management
- 1.3.3.12 Product planning meeting
- 1.3.3.13 Participate in project management, demostrations, and summaries
- 1.3.3.14 Basic statistical reports of stories
-
1.3.4. Project manager
- 1.3.4.1 Create a project
- 1.3.4.2 Set up the project team
- 1.3.4.3 Determaine the story list in a project
- 1.3.4.4 Task Breakdown
- 1.3.4.5 Daily standup meetings
- 1.3.4.6 Track the progress of projects via Burndown chart
- 1.3.4.7 Track the progress of projects via various lists
- 1.3.4.8 The review meeting and retrospective meeting
- 1.3.4.9 Basic statistical reports for project tasks
- 1.3.5. Development team
-
1.4. QuickStart of ZenTao Biz 12 series
- 1.4.1 Gantt Chart
Track the progress of projects via Burndown chart
- 2022-12-14 16:55:59
- Kelsea
- 1470
- Last edited by on 2023-01-05 13:39:02
- Share links
Except for coding and standup meetings, the DEV team should have to update the task status and estimate the man-hour left of the tasks that they are in charge of. ZenTao will generate a Burndown chart according to the overall estimated renaming hours of all the tasks in a project. Now, let’s look at an example.
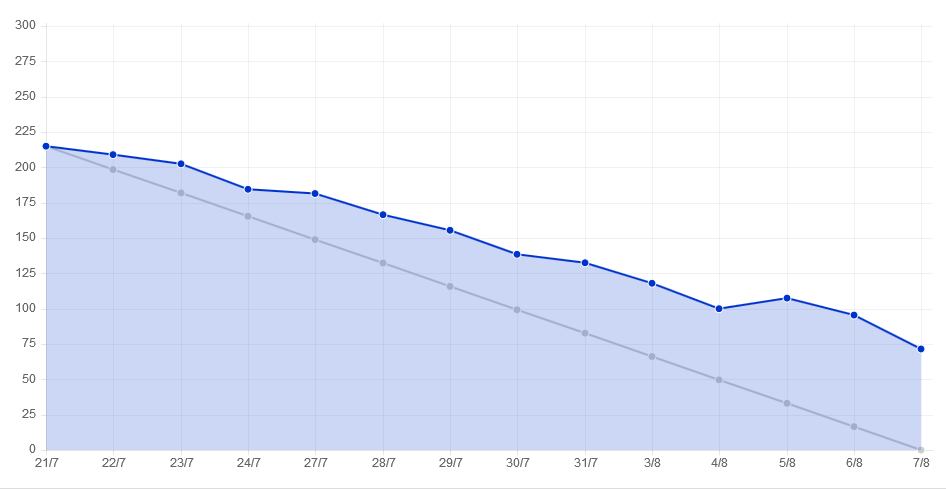
- The horizontal axis shows the dates and the vertical axis man hours.
- The hours are the sum of the remaining work hours for all tasks in the project. And the remaining work hours are calculated every day as well as shows on the Burndown Chart.
- In the new version, Users can set whether to show weekends or not in the burnout chart, and also edit the first day estimated work hours of the project.
- When the available working days are more than 31 days, the burnout chart will display the interval time setting drop-down box for adjusting the display interval of the horizontal coordinate date.
- In order to update the Burndown chart, you need to set scheduled tasks. Please refer to 4.1.4 How to update a Burundown chart.
The difference between Burndown chart and Gantt chart :
The core management philosophy of ZenTao is based on Scrum, so its main tool is Burndown chart instead of Gantt chart, which also represents two distinct management ideas. Gantt chart is management by controlling which is done by setting a start and end time and positions strictly; Burndown chart is more about the remaining hours of the project. So in ZenTao, we do hope that you can make full use of the Burndown chart.
Also, ZenTao Biz and ZenTao Max also provide the Gantt Chart. Please refer to 5.6.3 Introduction of the Gantt Chart. And if you need, you can contact us for subscribe.

Support
- Book a Demo
- Tech Forum
- GitHub
- SourceForge
About Us
- Company
- Privacy Policy
- Term of Use
- Blogs
- Partners
Contact Us
- Leave a Message
- Email Us: [email protected]


