
Gantt Charts and Agile: charts, methodology and tools
- 2018-02-26 17:14:00
- Renee Fey Original
- 11275
Gantt Charts and Agile: charts, methodology and tools
A Gantt chart is a scheduling tool used in project management to show what has to be done and when. Since the first Gantt chart was created over a century ago, Gantt chart has been identified as "one of the most widely used management tools for project scheduling and control".1If you want to learn more about Gantt charts and its importance, read The Importance of Gantt Charts.
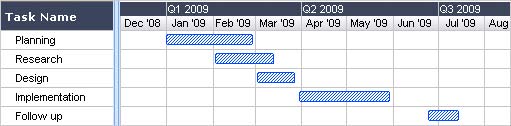
A Simple Gantt chart
What are Gantt charts?
Gantt charts are named after Henry Gantt, an American engineer and project management consultant, who devised his own version of the chart based on Karol Adamiecki who created the very first Gantt chart.
Let's look at an example from Wikipedia and see how a Gantt chart converts data into a diagram.
"There are seven tasks, labeled through g. Some tasks can be done concurrently (a and b) while others cannot be done until their predecessor task is complete (c and d cannot begin until a is complete). Additionally, each task has three-time estimates: the optimistic time estimate (O), the most likely or normal time estimate (M), and the pessimistic time estimate (P). The expected time (TE) is estimated using the beta probability distribution for the time estimates, using the formula (O + 4M + P) ÷ 6."

The diagram below is a Gantt chart with all information provided in the table above.
Gantt Chart and Task Dependencies
Dependencies define the relationships between tasks; they are used to determine when a task should begin or end in relation to other tasks. Dependencies occur as lines connecting two tasks or relating a task to a milestone on the Gantt Chart.
There are four types of dependencies you can create in ZenTao:
|
Dependency |
Function |
|
Finish to Start |
Task B can't start before Task A is finished. |
|
Start to Start |
Task B can't start before Task A starts. |
|
Finish to Finish |
Task B can't finish before Task A is finished. |
|
Start to Finish |
Task A can't finish before Task B starts. |
What is a Gantt chart in Agile?
In the context of Agile software development, a Gantt chart is used to illustrate releases or sprints.
The primary purpose of using Agile is to enable a faster reaction to requirement changes. As requirements change, the effort and time change, too. Therefore, in order to adequately adapt to changes and visualize the total amount of work left, Gantt charts would have to be updated almost all the time, which would be a burden on your development team. Fortunately, you can use an Agile tool to help you do it, rather than cross out everything on your chart and start it over.
Many people are used to making priority lists in Excel or other spreadsheet applications. They should have made a basic Gantt Chart, such as the one shown in this free template. This is helpful for making a list of objects for a single user to access. When you wish to engage more participants in the activity, making the Gantt Chart online becomes even simpler.
Gantt Chart Software and Tools
A Gantt chart's vertical axis represents the tasks that must be done, while the horizontal axis represents time. When you enter tasks, their start dates, end dates, and dependencies, bars representing task durations may appear. If you use a Gantt preparation application, such as Gantt Chart software, this happens automatically.
As computers invented new methods of operating, project managers discovered that they could save time designing and editing Gantt Charts. Gantt chart software, also known as project planning software, project management software, or project scheduling software, was designed to simplify the process of supporting more advanced Gantt criteria such as creating task dependencies, adding deadlines, or determining the critical path.
ZenTao is an open source and Agile tool that supports Gantt Chart. The main design philosophy of ZenTao is based onScrum, an internationally popular Agile methodology. ZenTao is an All Lifecycle Management (ALM) and covers the entire lifecycle of software development. In ZenTao, the concepts of product, project, and test are clearly defined. Product team, development team and QA team coordinate and check with each other while they function differently. The three teams interact with each other through stories, tasks, and bugs, and eventually deliver the product with quality.

Reference
1. Klein, R. (1999).Scheduling of Resource-Constrained Projects. Operations Research/Computer Science Interfaces Series. Springer US.ISBN978-0-7923-8637-7.
2. https://en.wikipedia.org/wiki/Gantt_chart
3. http://www.gantt.com/
Support
- Book a Demo
- Tech Forum
- GitHub
- SourceForge
About Us
- Company
- Privacy Policy
- Term of Use
- Blogs
- Partners
Contact Us
- Leave a Message
- Email Us: [email protected]


